HSV kymography
Author: MSc Anna Racino, Ph.D. Marcin Just, Ph.D. Michał Tyc (DiagNova Technologies)Date: 2021.05.01
The recording made with a high-speed camera allows for a reliable analysis of the folds movement. The actual movement of the vocal folds (2400 frames) is recorded on the High Speed recording. Then the recording is played back in slow motion (20 frames/s), which allows performing a full kymographic analysis. Right-clicking on the selected HSV video sequence and selecting the HSV Kymography in a separate examination window option opens an additional tab 1 for kymographic analysis of the high speed recording (Fig. 1). The first tab Fragment Selection (Fig. 1) starts the kymography. As in the case of kymography from videostroboscopic recording, on this tab the user selects the appropriate fragment of the recording. This fragment should show the entire length of the vocal folds, if possible visible in the center of the image, without any structures that could obscure the whole or a part of the glottis.
The user marks the beginning and end of the selected fragment of the recording with sliders 2. The first slider from the top allows you to preview the video sequence. The second and third sliders allow you to define the beginning and end of the fragment to be analyzed.
Contrary to the videostroboscopic recording, the high speed camera recording of the movement of the vocal folds allows to record many periods of this movement (many full short circuits and openings of the vocal folds). This allows running a larger sample analysis. This makes the kymographic analysis more reliable.
As in the HSV file adding window, also in this window it is possible to correct the image. In addition, the Correction Panel button 3 allows opening the window for precise image color correction.
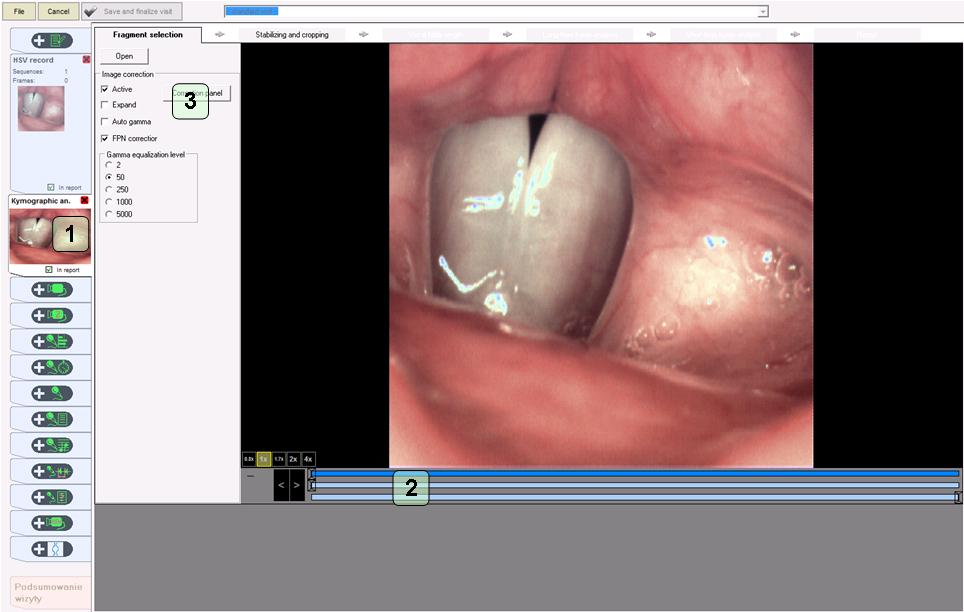
Fig. 1. Kymographic analysis window - Fragment selection
After selecting the appropriate fragment of the recorded fast movie sequence, go to the next tab Stabilizing and cropping (Fig. 2a). In this tab, the user marks the place where the vocal folds occur. Use the blue line to mark the beginning and end of the vocal folds (Fig. 2b). The user may place a marker on any selected frame where the vocal folds are best seen. The program will automatically find the indicated points on the remaining frames of the video sequence after switching to the next tab.
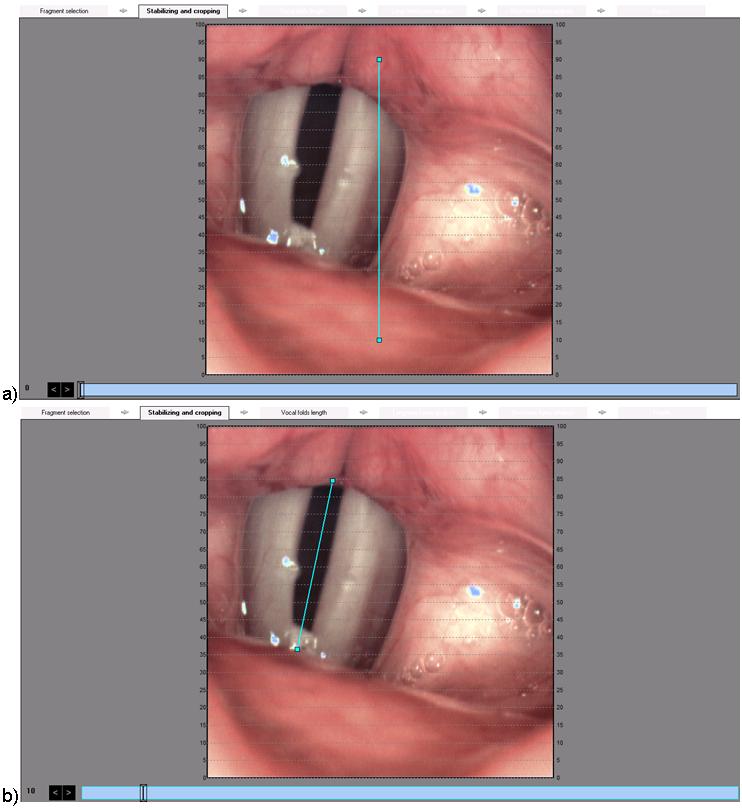
Fig. 2. Kymographic analysis window - Stabilizing and cropping; top: opened tab, bottom: setting marker for fold position
After correctly marking the location of the vocal folds, it is possible to proceed to the next stage of the analysis – Vocal folds length (Fig. 3). In this tab, the preview of recorded voices is automatically modified based on the marking on the previous tab. Voice folds in the preview are properly cropped and stabilized. On this tab, define the Vocal folds length range (blue indicator) and the Vocal folds opening range (green indicator) using the indicators. In the event that the vocal folds are not fully visible in the image, the indicators may be positioned in a black area outside of the recorded image where the end of the creases can be expected to occur. The user-set indicators will change from gray to blue or green. In case the user does not set the marker, the program will take into account the default setting (in gray).
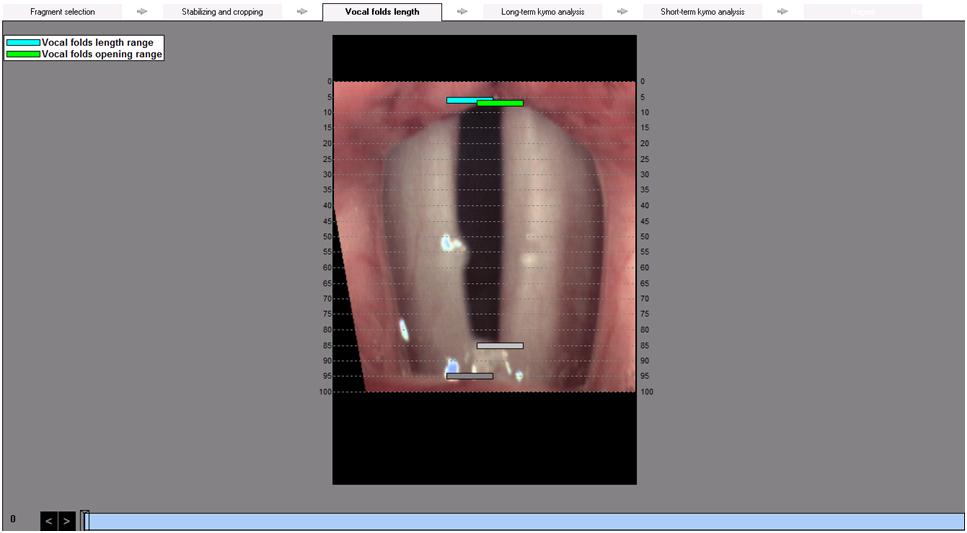
Fig. 3. Kymographic analysis window - Vocal folds length
The last stage of the kymographic analysis is the preparation of the Report (Fig.17). Depending on the selected template, the report contains the saved images (at the bottom of the window) and the cells with Parameters for numerical analysis of HSV recordings. Saved images can be added to the report by dragging them with the mouse onto the report filed.
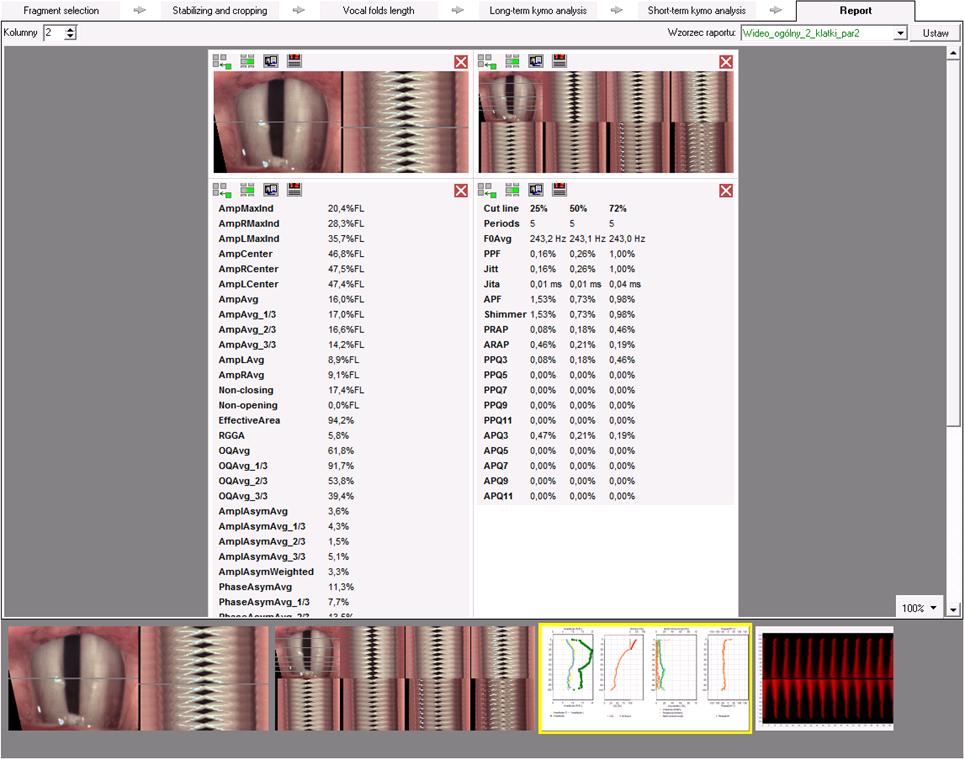
Fig. 17. Kymographic analysis window – Report