Kymography - Long-term kymo analysis
Autor: MSc Anna Racino, Ph.D. Marcin Just, Ph.D. Michał Tyc (DiagNova Technologies)Date: 2021.05.01
On the Long-term kymo analysis tab (Fig. 4) the user selects the most interesting cross-section sites (Kymography tab).The position of the cross-section of the folds is marked with gray markers. Clicking on the selected marker will change its color. Such a marker can be freely moved up and down along the fold axis. There can be set up to 3 such places (Fig. 5). Double clicking on the folds image will add a picture with visible folds and lines marking the places of the sections 4.
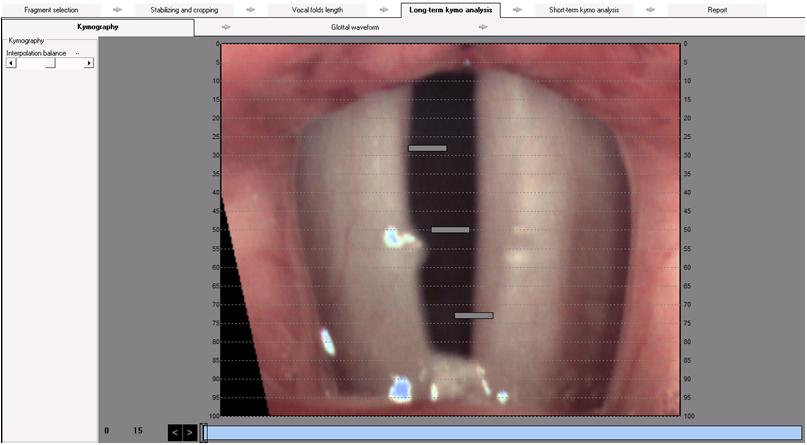
Fig. 4. Kymographic analysis window – Long-term kymo analysis -> Kymography
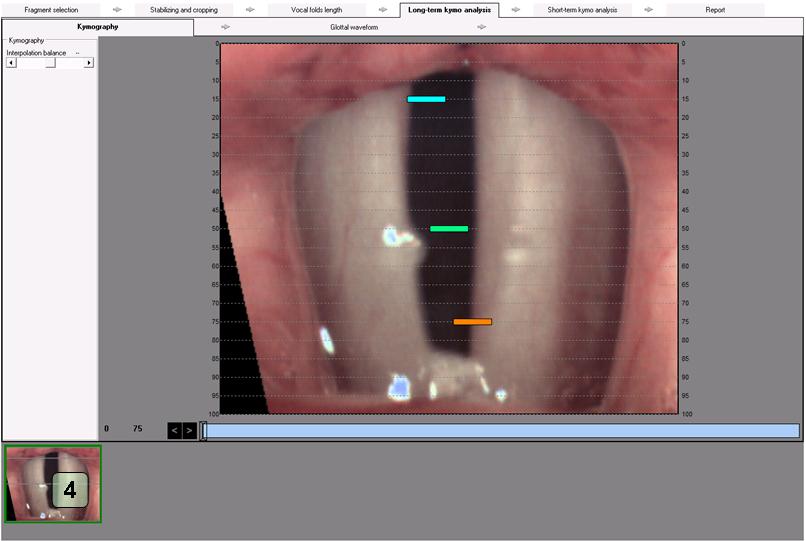
Fig. 5. Kymographic analysis window – Long-term kymo analysis -> Kymography
Selecting at least one site of the cross-section of the vocal folds allows for moving to the next tab of the long-term analysis - Glottal waveform (Fig. 6). In this tab, the user defines the range of the maximum opening of the vocal folds. Kymography for every marked cross-section are previewed on the colored tabs 5 (corresponding to the color of the section marking).

Fig. 6. Kymographic analysis window – Long-term kymo analysis -> Glottal waveform
Kymographic images can be smoothed by pressing the Interpolation 6 button (Fig. 7). With the All option selected, all kymographic sections will be smoothed automatically.
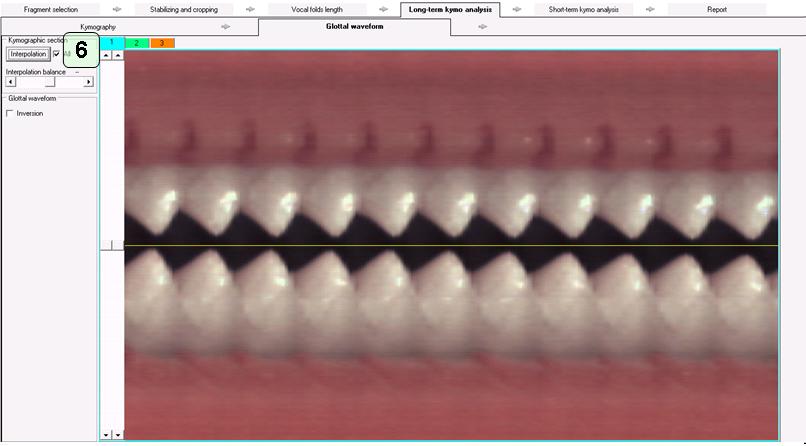
Fig. 7. Kymographic analysis window – Long-term kymo analysis -> Glottal waveform; image smoothed by Interpolation
At this stage of the analysis, the user determines the range of the glottis opening on each selected section by means of two lines shifted with sliders 7 (Fig. 8). This range determines the width of the search for the maximum opening of the vocal folds, i.e. it determines the scope of the kymographic analysis performed.

Fig. 8. Kymographic analysis window – Long-term kymo analysis -> Glottal waveform; determining the range of the glottis opening
Double clicking on the kymographic image will add a picture with visible waveforms for using in the report.
After switching to the tab Glottal waveform analysis (Fig. 9)the first results of the long-term kymographic analysis are displayed - the graph of the glottis opening process (given as a percentage) in relation to time 8. This graph describes the degree of glottis opening (fullest opening is 100% and full closure 0%). The chart is automatically displayed for all cross-section lines simultaneously. It is possible to turn off the view of some sections in order to analyze one of them in more detail 9.
Pressing the Calculate button 10 allows you to calculate the set of parameters in the table below for each of the cross-sections and the graph of the fundamental frequency versus time 11.
Also in the case of this chart, it is possible to disable the chart preview from some sections 9.
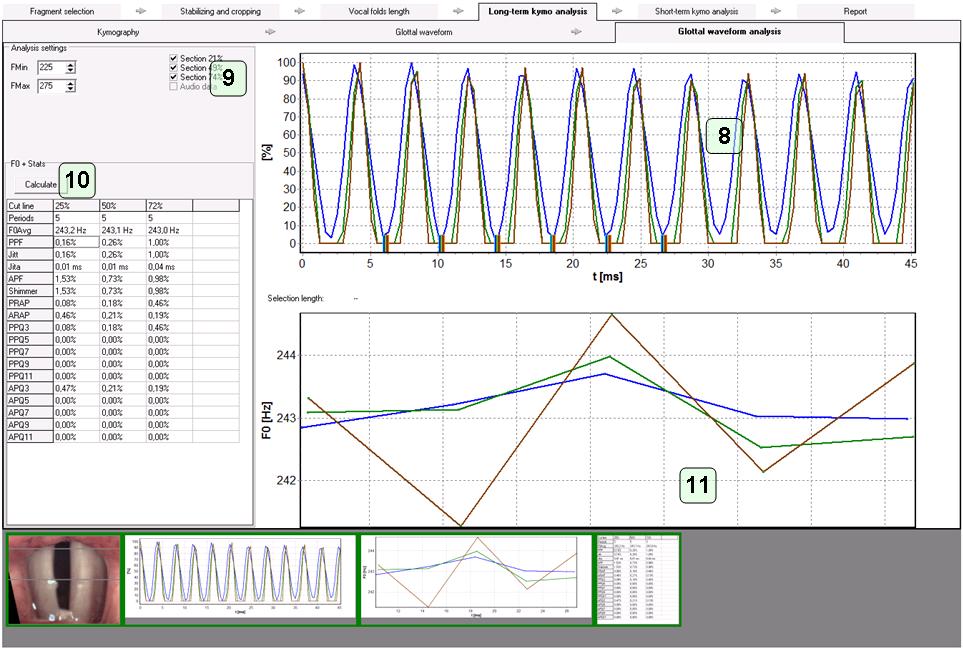
Fig. 9. Kymographic analysis window – Long-term kymo analysis -> Glottal waveform analysis
Table 1 Long-term kymo parameters:
| PARAMETER | DESCRIPTION |
|---|---|
| F0Avg | Average fundamental frequency |
| PPF [%] |
Period Perturbation Factor 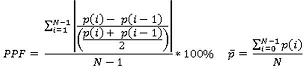
|
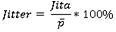
| Jitt [%] |
|
| Jita [ms] |
mean Jitter 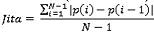
|
| APF [%] |
Amplitude Perturbation Factor 
|
| Shimmer [%] |
|
| PRAP [%] |
Period Relative Average Perturbation 
|
| ARAP [%] |
Amplitude Relative Average Perturbation 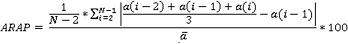
|
| PPQk [%] |
Period Perturbation Quotient with k averaging area width 
|
| APQk [%] |
Amplitude Perturbation Quotient with k averaging area width 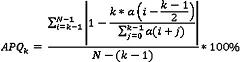
|